5 KPIs You Can Use To Measure Your Blog's Success
The importance and value of blogging for your business cannot be overstated. It's a key component of content marketing, and it can help your company establish itself as a subject-matter expert while also driving traffic and generating leads. But how do you know if your hard work is paying off?
Here are five key performance indicators to use when evaluating the success of your blog. To get started, we'll show you how to set up Google Analytics to track your blog's traffic in a few different ways.
Create filters
It's as simple as adding the Google Analytics tracking code to your blog if it's a completely separate, standalone site. Many businesses, on the other hand, include their blog as a section of their website. There are a few options for viewing only blog traffic. Create a new Google Analytics view, add a new segment to an existing view, or filter your Site Content section to only show blog pages. In a pdf, we've outlined each of these steps.
-
Sessions
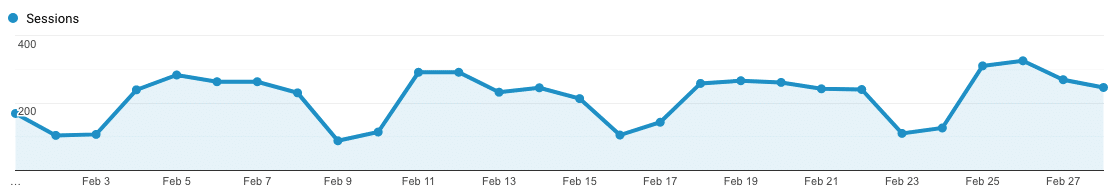
Credit: B2C.com
Sessions, which measure overall blog traffic, are one of the most important metrics to track for your blog. A visit is the amount of time a user spends on your website during a session. One user could visit your blog multiple times over time.
It's crucial to track your traffic over time and in context, rather than just counting the number of sessions. Compare your traffic from month to month to see if there is any growth or patterns. Examine the topics and formats of blog posts from the months with the best results and the months with the worst results to spot trends. You can improve your strategy moving forward by comparing performance to the type of content, post frequency, and distribution strategy.
2. Top Posts by Pageviews
This one is easy to grasp. Examine the pageviews for each article to see which blog posts are getting the most attention. Then use other metrics to figure out why those posts were the most popular. (This can be found under Behavior – Site Content – All Pages.) Is there a high percentage of Organic Search traffic to your top post? This article might have been particularly well-optimized for search engines. Was there any video in the post? You might want to think about including more video in your posts. Examine these various metrics together on a regular basis and look for trends to help guide your content strategy moving forward.
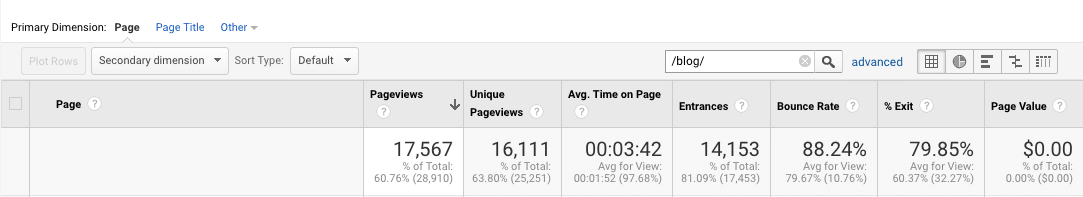
3. Average Time on Page
The same tab displays the Average Time on Page, which indicates how long users spend on average viewing a page. You can keep track of the overall average as well as the average time spent on each of your pages. This is a good indicator of engagement and how relevant your content is to your target audience. If a post's average time on page is extremely low, it's possible that the article isn't what users expected based on the preview, or that the introduction or copy in general isn't very engaging. Compare the articles with the shortest average time to the articles with the longest, and look for common themes in content type, length, formatting, and headlines.
Average Pages per Session and Average Session Duration are two other metrics to track to gauge engagement. Both indicate how well you are delivering value through your content and making it easy for people to navigate through your site to see more.
4. Traffic Channels
It's critical to understand how your blog's visitors reach your blog. Organic Search, Direct, Referral, Email, and Social are the default acquisition channels in Google Analytics. Organic search traffic measures users who arrive at your blog via a search engine, so it's often a good indicator of SEO success. If you break it down by individual pages, those with a high percentage of traffic from organic search are probably well optimized, while those with a low percentage may need to be.
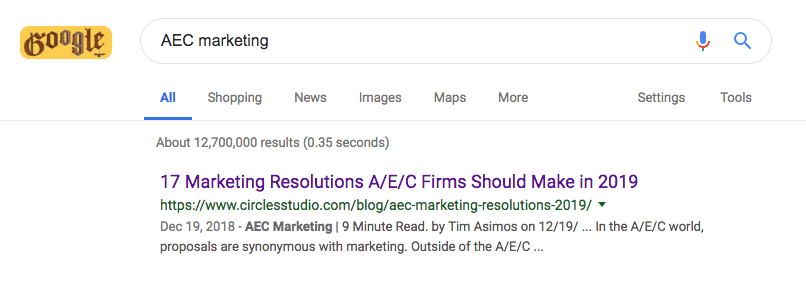
You can also check your SERP ranking for various topics that you'd like to rank for on a regular basis. If you Google "AEC marketing," for example, you'll find our 2019 AEC Marketing Trends blog post. You should see your blog move up the results page as you analyze and improve your SEO strategy.
Credit: HubSpot.com
Direct: Returning users are represented by direct traffic, which includes people who type the URL directly into their browser's address bar. A higher percentage of returning visitors indicates content that may be relevant to your regular readers when looking at direct traffic for specific posts.
Email traffic: Because your blog subscribers make up the majority of your email traffic, it can provide insight into the most popular blog posts among your subscribers.
Referral traffic comes from any other website, and you can see all of the different sources under Acquisition – All Traffic – Channels – Referral. You can view the individual blog pages to which the sources are directing by adding "Source" as a secondary dimension in the Behavior – Site Content – All Pages section, or by adding "Source" as a secondary dimension in the Behavior – Site Content – All Pages section.
Users who come to your blog via a social media link are known as social traffic. This is most likely a mix of returning and new visitors, as they may have come to your blog because they follow you or a friend shared your post. You can see which platforms and blog posts are generating the most traffic. You can also get some information by directly logging into the social media platforms and looking at their internal analytics. Open the Insights section of your Facebook page, for example, to see the reach and engagement of your posts. It shows the number of link clicks (not post clicks!) from a post where you shared a link to one of your blog articles.

5. New vs. Returning Visitors
The goal is for your content to provide enough value for users to want to return to your blog and read more. Email and direct traffic, as previously stated, are good indicators of returning user traffic. The Audience Overview tab in Google Analytics displays the ratio of new vs. returning users. You'll need an increasing number of people returning and subscribing to your blog, as well as new people discovering it, for it to grow. Go to Audience – Behavior – New vs. Returning to learn more about returning visitor analytics, including the number of users and sessions from returning visitors. If this number is rising, you're creating content that's expanding your audience and encouraging them to return to your blog.
Subscribe to our newsletter here.
